What is a Statistical Question in math?
Statistics is a field that has a lot draw and attention. People seem to be attracted by Statistics and its ethos, but usually people do not understand the real ethos of Statistics, and they tend to pay attention to certain elements that are perhaps less relevant than others.
What is best known about statistics by a broad audience? Its graphs, without a doubt. When people think about statistics, the first thing that comes to their mind is bar charts, histograms, scatterplots and all that. And it makes a lot of sense, but graphical depiction of data is the best known side of statistics.
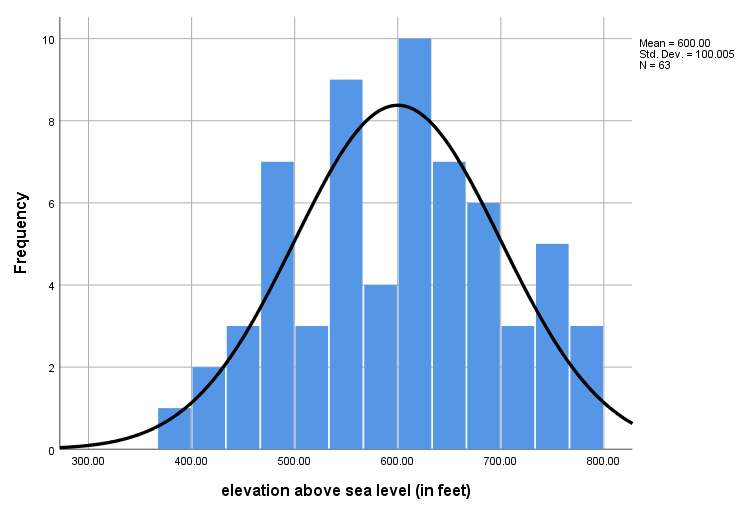
For example, the above char is a histogram, for a variable called "Elevation above sea level". The histogram above tells us A LOT about the variable. For example, we can see that the distribution is somewhat symmetric, but yet it has tiny degree of right skewness, which does not appear to be significant.
What can be answered with descriptive statistics only?
Descriptive statistics include graphs and statistics like the mean, mode, median and standard deviation among others. Descriptive statistics, like its name indicate so, have as its main purpose to DESCRIBE data.
The mean gives a "representative" measure of center, the standard deviation gives a "representative" measure of dispersion, provided that the distribution is not too skewed.
But often times, this idea of being "representative" is rather loose, and it does not give a clear, concrete representation of things, as it is fairly relative. Besides, let us not forget what is the ultimate objective of Statistics as a discipline: Use sample data to make CLAIMS about population parameters.
In other words, in Statistics we really want to go far and beyond mere descriptive statistics. Indeed, we want to say something about a population parameter that we don't know. The most common population parameter used is the population mean, but any population parameter will do.
Enter Inferential Statistics: Answering Real Statistical Questions in Math
Statistical questions are beyond wondering how does the distribution looks like when looking at a histogram. Statistics questions are about asking something about a population parameter.
For example, consider the "Elevation above sea level" variable. After we have come around seeing that its sample distribution appears to be relatively symmetric, I would perhaps like to ask the following question:
Question: Is the population mean elevation different from 400 feet?
This question could be relevant because say we are analyzing a zone for which we don't have maps for, but we know that the overall elevation in the area is 400 feet, and we sample of N = 64 data, which we would like to use in order to answer the above mentioned question.
It turns out that one very commonly used procedure to answer a statistical question about a population mean is the t-test for one sample. In this case, the results of a t-test are shown below:
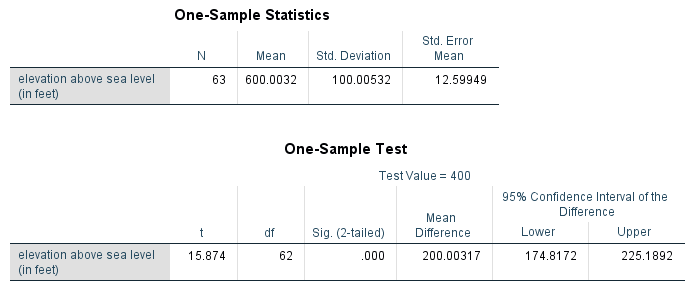
The beauty of this is that all the hard work is done with software. The output above shows a t-test output from SPSS, which is obtained by pressing a few keystrokes. Now our job is to interpret these results.
The t-statistic is t = 15.87, and the p-value is p = .0000, which is very small. A small p-value indicates that we reject the null hypothesis (The p-value is the likelihood of obtaining these kind of sample results if we assumed that the null hypothesis is true.
A very small p-value discredits the assumption that the null hypothesis is true, and then we reject it).
Why do we want to answer statistical questions like these and we don't limit ourselves to graphs?
Well, it would be much easier for many people to just stick to looking at graphs and interpret them by "saying what we feel" about them. Usually, real life, real math requires more precision.
Usually, in many contexts we may be looking for making policy decisions or budget allocations, in which we need concrete evidence to support a decision over another possibility.
Inferential statistics allow us to answer those more difficult statistical questions and to provide more evidence (if the sample data supports it) that will allow decision makers to make non trivial decisions.
Related Content

What is a Statistical Question in math? - StatisticsHelp

Combining Efforts with a Statistics Expert - StatisticsHelp