
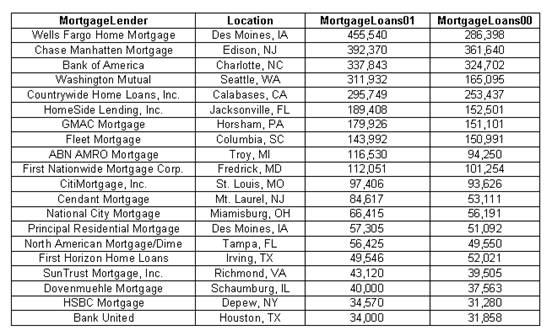
During the year of 2001, in the US residential lenders were saturated in refinancing
During the year of 2001, in the US residential lenders were saturated in refinancing. The total mortgage packages approved exceeded $1.5 trillion. However, refinancing was not homogeneous across the US. Twenty major mortgage institutions were randomly selected, and the total refinancing was recorded for 2001 and 2000 (data are in the “QMCoursework-data” spreadsheet).
· Do the data support the hypothesis that there is a linear relationship between the amounts in each year?
· Is any observation influential?
Solution: The correlation coefficient is equal to
![]()
In order to test that there is a significant correlation between the variables we compute the following t-statistics:
![]()
The p-value is p = 0.000, which means that the correlation coefficient is significantly different from zero. This supports the hypothesis hat there is a linear relationship between the amounts in each year.
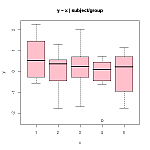
Influential Observation: As can be seen in the scatter plot below:
there are a couple of influential observations, but they are not too strong because the slope of the regression line doesn’t change much because of them
Regression Analysis

The regression equation is
![]()
Related Content
Collection of Solved Statistics Problems - StatisticsHelp

Combining Efforts with a Statistics Expert - StatisticsHelp
