
The boxplots below depict the residuals from two separate fitted regressions
The boxplots below depict the residuals from two separate fitted regressions. For which model (#1 or #2) is the SSE smaller? Why?
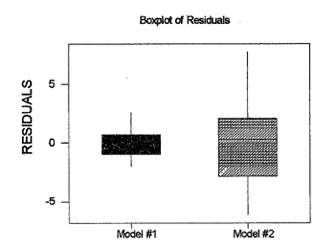
Solution: Model #1, because the residuals are more concentrated around zero, which implies a smaller SSE.
Stats Solution Summary
Descriptive statistics are crucial to quickly depict a variable's distribution. And in the context of the calculation of descriptive statistics, using graphical depictions could be even more usefil
A box plot in this case plays an important role at depicting the distribution overall, with a clear view of what the outliers are, if any.
Related Content

Combining Efforts with a Statistics Expert - StatisticsHelp

Statistics Help: Where To Find it? - StatisticsHelp
