The ages (in years) of 7 men and their systolic blood pressures are listed in the chart below
The ages (in years) of 7 men and their systolic blood pressures are listed in the chart below.
Ages x 16 25 45 49 64 70 39
Systolic y 109 122 132 199 185 199 143
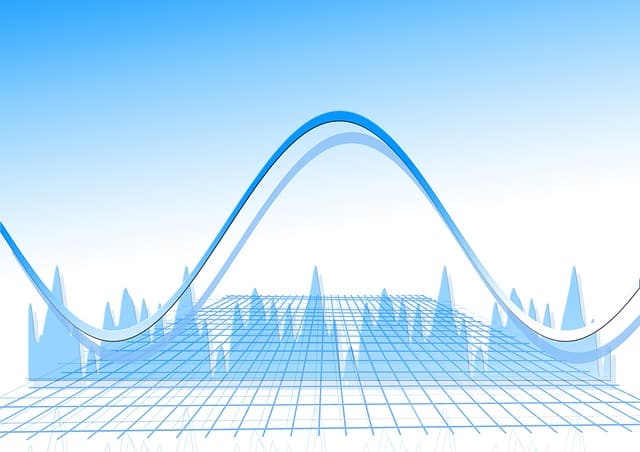
a) Display a scatter plot: Using Minitab we get the following graph
b) Calculate the correlation coefficient, r:
c) Decide if there is correlation or not
d) If correlation exists, then find the Regression Line (predicting line)
e) What would be the best estimated Systolic Blood pressure of a man 40 years of age?
f) What would be the best estimated Systolic Blood pressure of a man 82 years old?
Solution: (a) We get
(b) The correlation coefficient is 0.88346
(c) The correlation is significantly different from zero, as shown by the following display:
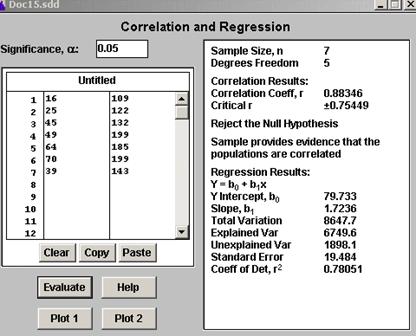
(d) The regression line is:
![]()
(e) We evaluate ![]() in our regression line, obtaining that the best estimated Systolic Blood pressure of a man 40 years of age is
in our regression line, obtaining that the best estimated Systolic Blood pressure of a man 40 years of age is
![]()
(f) We shouldn’t try to use our regression line to estimate out of range values. 82 is out of range so the estimate given by the regression equation shouldn’t be used.
Math 157 Chapter 5 & 6 Take home Name
Related Content

Combining Efforts with a Statistics Expert - StatisticsHelp

The U.S. Weather Bureau has provided the following information about - StatisticsHelp