
Students were paired by matching their IQs and grades in previous mathematics courses taken
Students were paired by matching their IQs and grades in previous mathematics courses taken. Group A attended lecture and did homework. Group B watched videotapes and did work on a computer. Test to see if there is a significant difference in final exam scores for 2 groups at the .05 level.
Lecture
95
87
91
85
81
79
74
73
71
69
Tapes
99
91
88
90
87
78
79
81
65
74
Solution: We have paired samples, so we have to use t-test for independent samples. We want to test the following hypotheses:
![]()
We need to compute the t-statistics for this 2-tailed test. Before that, we need to test to see if the variances can be considered the same. We use Excel to get
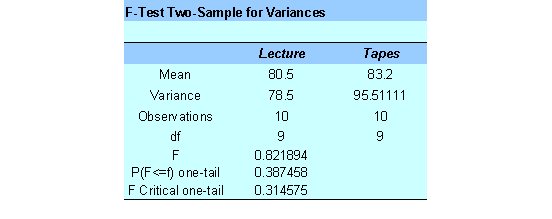
We see that the p-value is 0.387458, which is greater than the significance level![]() , and therefore we cannot reject the null hypothesis of equal variances.
, and therefore we cannot reject the null hypothesis of equal variances.
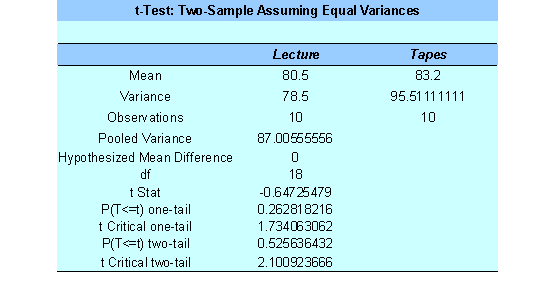
Now we test our main hypothesis assuming that the variances are equal. The t-statistics is found using Excel:
|
| ||
|
|
||
|
|
Lecture |
Tapes |
|
|
80.5 |
83.2 |
|
|
78.5 |
95.51111111 |
|
|
10 |
10 |
|
|
87.00555556 |
|
|
|
0 |
|
|
|
18 |
|
|
|
-0.64725479 |
|
|
|
0.262818216 |
|
|
|
1.734063062 |
|
|
|
0.525636432 |
|
|
|
2.100923666 |
|
We observe that the p-value is 0.5256, which is greater than the significance level![]() , which means that we fail to reject the null hypothesis. In other words, we don’t have enough evidence to claim that there is a significant difference in final exam scores for 2 groups at the .05 level
, which means that we fail to reject the null hypothesis. In other words, we don’t have enough evidence to claim that there is a significant difference in final exam scores for 2 groups at the .05 level
Related Content

Combining Efforts with a Statistics Expert - StatisticsHelp
The U.S. Weather Bureau has provided the following information about - StatisticsHelp