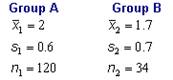
You are given the following data
You are given the following data. Test the claim that there is a difference in the means of the two groups. Use a = 0.10.
Solution: We need to test the following null and alternative hypothesis:
![]()
We need to apply a two-tailed t-test. The calculations are summarized below:
The t-statistics is t = 2.478, and the corresponding p-value is p = 0.014, which means that we reject the null hypothesis. This implies that there is a difference in the means of the two groups, at the 0.10 significance level.
Related Content
Collection of Solved Statistics Problems - StatisticsHelp
The U.S. Weather Bureau has provided the following information about - StatisticsHelp