
Emergency team responds to calls in a mean time of 8
Emergency team responds to calls in a mean time of 8.4 minutes with a standard deviation of .7. A new dispatching system is being tested to see if response time can be lowered. If a sample of 18 calls with the new system were answered in mean time of 7.8 minutes, test at the .05 level. State hypotheses and identify claim, find critical value(s), compute test value, make decision, summarize results.
Solution: We have to test the following hypotheses:
![]()
In this case, our claim is the alternative hypothesis. We use a one-sample, left-tailed (because the rejection zone is to the left of 8.4) t-test:
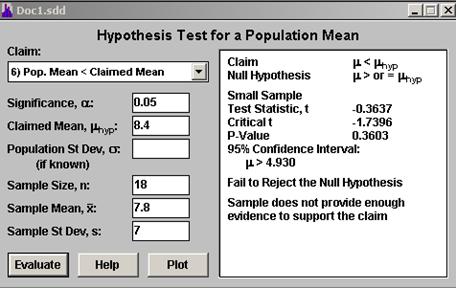
The t-statistics is computed as
![]()
The critical value at the 0.05 significance level is -1.7396. This means that we fail to reject the null hypothesis, and therefore, we don’t have enough evidence to support the claim.
Related Content

Combining Efforts with a Statistics Expert - StatisticsHelp

Statistics Help: Where To Find it? - StatisticsHelp