The following table shows the number of applicants accepted and refused by different graduate programs of a big university
The following table shows the number of applicants accepted and refused by different graduate programs of a big university. The table shows the name of the program, the gender of the applicant, and the decision on the application.
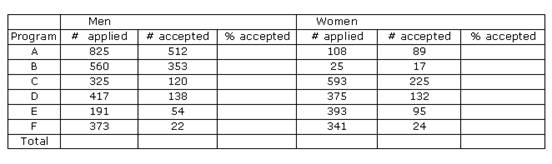
a) Fill the blank columns of the above table.
b) If you look at each program, who is being admitted in higher percentage, men or women?
c) If you look at the acceptance rate overall, who is being admitted in higher percentage, men or women?
d) State clearly, a reason as to why do we have opposite answers in the parts b) and c.)
Solution: (a) The completed table is shown below:
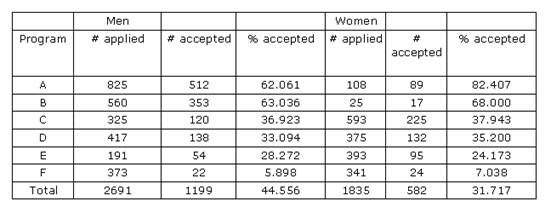
(b) Women have higher admittance percentage than men in programs A, B, C D and F. This is every program, except to program E
(c) Men are being accepted in higher percentage than women. In fact 44.556% of men are accepted whereas 31.717% women are accepted.
(d) The reason is that women score a low acceptance rate in program F (only 7.038%), which proportionally brings a significant portion of the total applicants.
Related Content

Combining Efforts with a Statistics Expert - StatisticsHelp

Statistics Help: Where To Find it? - StatisticsHelp