he bar graph below shows the number of car accidents occurring in one city in each of the years 1993 through 1998
he bar graph below shows the number of car accidents occurring in one city in each of the years 1993 through 1998. The number of accidents dropped in 1995 after a new speed limit was imposed. Why is the graph misleading? How would you redesign the graph to be less misleading? Explain your thinking.
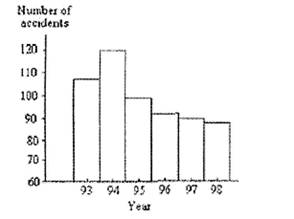
Solution: The graph is misleading because the bar starts in the middle of 1994 and 1995, and not exactly in 1995. That means it also considers cases that happened before the new speed limit was imposed. We should redesign the graph in such a way that the bar starts exactly after the new speed limit is imposed.
Related Content

Combining Efforts with a Statistics Expert - StatisticsHelp

Statistics Help: Where To Find it? - StatisticsHelp